Most mobile market forecasts are built on high-level industry reports. They tell you the market is growing. They don't tell you which categories, which price points, or which signals to watch.
That's the gap Android app datasets fill.
A well-structured Android app dataset gives you granular, ground-level data: category distribution, install ranges, rating trends, update frequency, monetization patterns. When analyzed consistently over time, that data stops describing the market and starts predicting it.
The mobile applications market is expected to grow from USD 243.8 billion in 2025 to USD 543.8 billion in 2030, at a CAGR of 17.4%. Crawl Feeds positioned to capture that growth are the ones working from data, not assumptions.
Here's exactly how Android app datasets support market trend forecasting, and what to look for when you use them.
Why Android App Data Is a Forecasting Asset, Not Just a Research Tool
Most people treat app datasets as a lookup table. They want to know how many installs a specific app has, or what category it belongs to.
That's one use. It's not the most valuable one.
The real power of an Android app dataset is longitudinal analysis. When you track the same dataset over multiple time periods, patterns emerge. Categories gaining new SKUs. Rating averages shifting. Update frequency declining. Install buckets changing.
Google Play currently hosts 2.06 million apps as of Q2 2025, growing from 1.68 million in 2024, with gaming accounting for 21% of downloads. The category-level breakdown tells you everything.
Here's how to use it.
1. Category SKU Growth as a Leading Market Indicator
New app submissions by category are one of the most underused signals in Android data.
When a category starts accumulating new SKUs at an accelerating rate, it means developers are betting on that space. Development cycles run 6–12 months ahead of consumer demand. So a surge in new apps in a category today is a reliable signal of where consumer attention is heading in the next 12–18 months.
Generative AI apps led category growth with a 109% year-over-year increase on Android, while Finance remained a cross-platform safe bet at +26%.
How to apply this:
- Pull a monthly snapshot of new apps by category
- Track the rate of change, not just the absolute count
- Flag categories showing 20%+ SKU growth over two consecutive months as emerging segments
This is how you get ahead of a trend instead of reporting on one after the fact.
2. Install Bucket Shifts Signal Demand Momentum
Android's install counts are bucketed ranges: 1K+, 10K+, 100K+, 1M+, and so on. Most analysts treat this as a limitation. It's actually a feature when used correctly.
Track how many apps move up a bucket within a category over time. If 30 apps in the Health & Fitness category jumped from the 100K+ bucket to the 1M+ bucket in a single quarter, that category is accelerating. That's a real demand signal.
Games dominate with 34.54 billion downloads globally, but Entertainment, Finance, Productivity, and Shopping each surpass 5 billion installs, together accounting for more than 50% of global app installs.
The install distribution across categories tells you where user attention has consolidated. The rate of bucket movement tells you where it's heading next.
What this means for forecasting:
|
Signal |
What It Indicates |
|
Multiple apps moving up install buckets |
Category demand accelerating |
|
Flat install distribution over 6 months |
Mature or stagnating category |
|
High install count + declining rating average |
Scaling problem, trust erosion |
|
Low install count + high rating |
Early-stage, high-quality signal |
3. Rating Trend Analysis to Identify Category Health
A snapshot rating score is almost meaningless for forecasting. A trend line is everything.
When the average rating across a category declines over multiple months, it signals one of two things: either quality is dropping as more low-effort apps enter the space, or consumer expectations are rising faster than apps can meet them. Both are useful forecasting signals.
Research using Play Store datasets found that machine learning models using ratings, installs, and category features can predict app success metrics with 85%+ accuracy.
The counter-intuitive insight: Categories with a declining average rating often represent the best entry points for new apps. Consumer dissatisfaction is documented in the data before it's documented anywhere else. If you're building or investing, this is your early warning signal, not a reason to avoid the category.
Track three metrics together:
- Average category rating (month-over-month)
- Review volume per new app (are new entrants getting feedback?)
- Rating standard deviation (are scores spreading out, suggesting a divided market?)
4. Update Frequency as a Proxy for Developer Confidence
The last_updated field is one of the most overlooked columns in any Android app dataset. It shouldn't be.
Update frequency is a direct proxy for developer investment. Apps that are updated regularly have active development teams, responsive user feedback loops, and sustained feature roadmaps. Apps that haven't been updated in 12+ months are either abandoned or running purely on inertia.
At a category level, this becomes a forecasting signal. When the average update frequency in a category drops, developer confidence in that space is falling. When it rises, money and talent are moving in.
Apply this filter before any market entry analysis. Remove apps with no update in 18+ months from your category benchmarks. The numbers change significantly, and so does your read of the competitive landscape.
5. Pricing Model Distribution Reveals Monetization Maturity
Track the ratio of free to paid apps within a category, and how in-app purchase flags correlate with install counts and ratings.
In-app advertising alone hit $362 billion in 2023, while consumer direct spend through app stores is forecast to reach $288 billion in 2030, up 267% from the prior decade.
A category where top-performing apps are free with in-app purchases signals a mature monetization model. One where paid apps still rank highly signals either a professional audience willing to pay upfront, or an underdeveloped freemium ecosystem, either of which is a useful input for product and pricing strategy.
Pricing distribution signals:
- Free + high IAP flag rate. Subscription or freemium model dominates. Users expect free entry.
- Paid apps with high ratings. Users value the product enough to pay upfront. Quality bar is high.
- Free with low IAP, high installs. Ad-supported model. Volume game, thin per-user revenue.
- Mixed pricing, high rating variance. Market not yet standardized. Opportunity or confusion, depending on execution.
6. Content Rating Distribution as a Regional Expansion Signal
Content rating fields (Everyone, Teen, Mature 17+) are rarely used for forecasting. They should be.
At a category level, the content rating distribution tells you about the intended user base and the implicit regulatory positioning of top apps. A category dominated by "Everyone" ratings is broadly accessible and globally deployable. A category with significant "Mature 17+" concentration signals regulatory complexity and market-specific demand.
Android posts strong install growth in non-Western markets, with Mexico, Saudi Arabia, and Southeast Asian countries showing consistent acceleration, while several Western Android-heavy markets show flat or declining trends.
If you're forecasting for regional expansion, content rating distribution by category gives you a quick read on regulatory risk and audience alignment before you commit resources. Pair it with regional install data and you have a market-entry risk matrix built entirely from the dataset.
7. Developer Concentration Analysis to Spot Consolidation Risk
Here's the forecasting use case most teams never consider.
Count the number of unique developers publishing in a category, then track how many of those developers account for 80% of the installs. That's your Pareto concentration ratio.
A category where 5 developers control 80% of installs is already consolidated. Market entry is expensive, and dislodging incumbents requires significant differentiation. A category where 50 developers share 80% of installs is fragmented, which means acquisition opportunity or growth potential for a product that executes better.
Enterprise market intelligence platforms aggregate data across app stores and ad networks to give companies broad visibility into how apps perform across multiple channels, including download and revenue estimates, category intelligence, and detailed competitor benchmarking.
You can build a simplified version of this analysis with a well-structured Android app dataset, no enterprise platform required.
Track this quarterly:
- Developer count per category
- Install share concentration
- New developer entry rate (new publishers per month)
Increasing developer count + declining concentration = category opening up. Decreasing developer count + increasing concentration = consolidation underway.
8. Cross-Field Analysis: The Framework Most Teams Skip
Individual fields tell you facts. Cross-field analysis tells you stories.
The most powerful forecasting signals in an Android app dataset come from combining columns, not reading them individually. Here are the most reliable combinations:
|
Cross-Field Analysis |
Forecasting Signal |
|
Category + New SKU rate + Install bucket movement |
Emerging category identification |
|
Rating trend + Review volume + Update frequency |
Category health trajectory |
|
Price type + Install count + Rating |
Monetization model effectiveness |
|
Developer count + Install concentration |
Market consolidation stage |
|
Content rating + Regional install data |
Expansion risk by market |
Structured Android app datasets support trend forecasting, sentiment analysis, ASO testing, recommendation systems, and competitive analysis across niche segments. Beauty Feeds extract the most value by building cross-field frameworks, not single-metric dashboards.
The Data Problem That Kills Most Forecasting Attempts
Here's where most teams hit a wall.
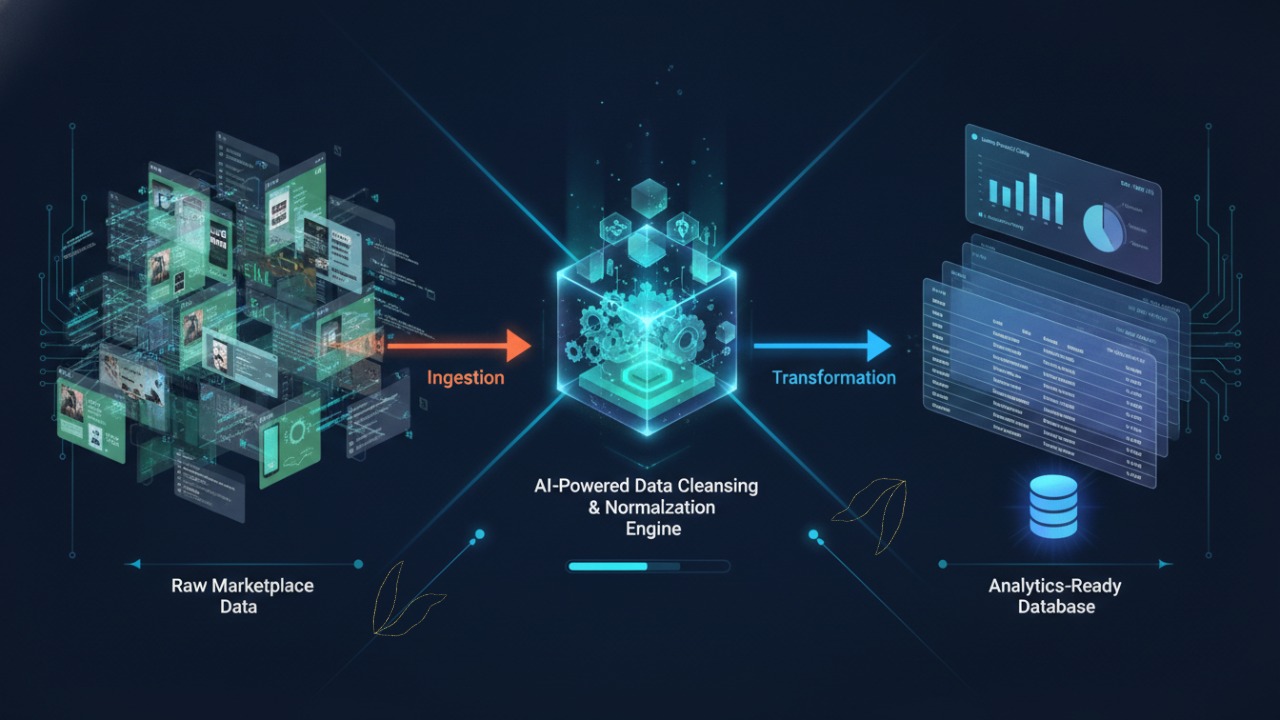
Static datasets go stale fast. A Kaggle snapshot from six months ago can't tell you what's happening in the market today. And raw scraped data requires significant cleaning before it's usable for any serious analysis.
The forecasting use cases above require data that is structured, current, and comprehensive enough to support time-series analysis. That's a specific requirement, and not every data source meets it.
This is the problem Crawl Feeds Android app datasets are built to address. If your team is trying to run category trend analysis, competitive benchmarking, or build a forecasting model and your current data source is either too stale or too messy to work with, structured Play Store data with consistent field coverage is the starting point you need.
Fields include app name, category, rating, review count, installs, price, content rating, developer details, last updated, and version data. Clean, structured, and ready for analysis without a three-week cleaning pipeline sitting between you and the insight.
Explore Android app dataset options on Crawl Feeds →
Final Word
An Android app dataset isn't a static reference file. It's a market intelligence system, but only if you use it that way.
The eight forecasting applications above work best when applied consistently over time, with fresh data, and with cross-field frameworks that go beyond single-metric reads.
The market is moving. Global app marketing spend reached $109 billion in 2025, with the mobile landscape shifting along multiple axes as iOS and Android diverge, Western and non-Western markets follow opposite trajectories, and AI adoption expands across campaign optimization.
Looking for a dataset?
Browse hundreds of pre-built datasets from CrawlFeeds — ecommerce, reviews, fashion, news, and more. Free samples on every dataset.
Browse datasets Custom data request